
109924


360-Degree Team Feedback Diagram - Google Slides theme and PowerPoint template

ID: 11261
Unlock this file and gain access to other Premium resources.
Go Premium and Download! | Already Premium? Sign in
Unlock this file and gain access to other Premium resources.
Go Premium and Download! | Already Premium? Sign in
Premium PowerPoint Template and Google Slides Theme
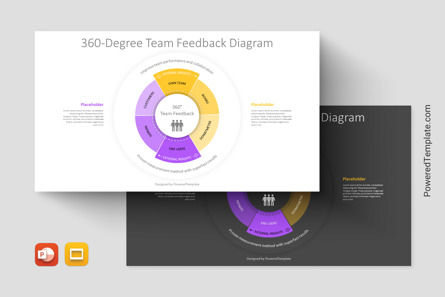
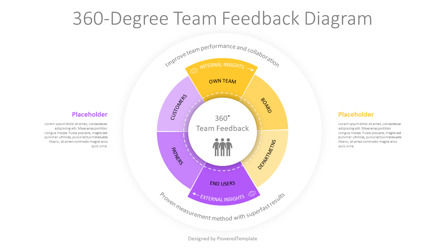
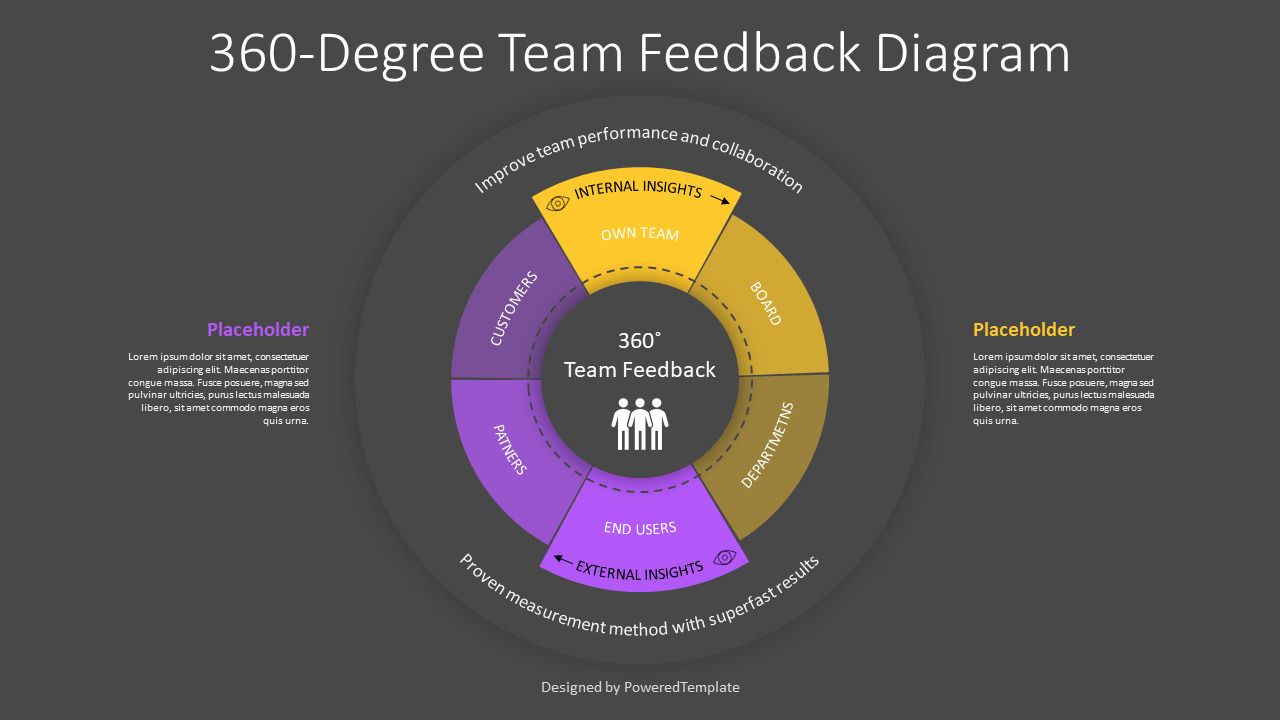
The 360-Degree Team Feedback Diagram presentation template is an excellent tool for teams seeking to improve their performance and collaboration. This template is available in both PowerPoint and Google Slides and features a circular diagram with 6 sectors, divided into two groups: Internal Insights - Own Team, Board, and Departments, and External Insights - End Users, Partners, and Customers.The 360-Degree Team Feedback process is a popular method used by organizations to gather feedback from various sources within and outside the organization. This feedback is then analyzed and used to improve team performance and collaboration. The process is called "360-degree" because feedback is collected from all angles, including from peers, subordinates, supervisors, and external stakeholders.
The Internal Insights group includes three sectors: Own Team, Board, and Departments. The Own Team sector represents feedback from team members, allowing for self-reflection and self-improvement. The Board sector represents feedback from the organization's board of directors, providing high-level feedback on the team's overall performance. The Departments sector represents feedback from other departments within the organization, highlighting opportunities for collaboration and alignment.
The External Insights group also includes three sectors: End Users, Partners, and Customers. The End Users sector represents feedback from those who use the team's products or services, providing insights into how the team can better serve its customers. The Partners sector represents feedback from the team's partners or vendors, highlighting opportunities for collaboration and improvement. The Customers sector represents feedback from the team's customers, providing valuable insights into the team's performance and how it can better serve its customer base.
This 360-Degree Team Feedback Diagram presentation template can be used by teams and organizations of all sizes and industries. It is particularly useful for teams seeking to improve their performance and collaboration, as well as for those looking to gather feedback from a variety of sources. The template can be used by HR departments, managers, and team leaders to present feedback in a clear and concise way, helping to drive positive change within the organization.
In summary, the 360-Degree Team Feedback Diagram presentation template is a powerful tool that can help organizations gather valuable feedback from a variety of sources and improve team performance and collaboration. With its clear and concise design, this template is an excellent resource for HR departments, managers, and team leaders looking to drive positive change within their organizations.
Template Features:
- - 100% editable and easy to modify
- - 2 dark and light slides to impress your audience
- - Contains easy-to-edit graphics
- - Designed to be used in Google Slides and Microsoft PowerPoint
- - PPT / PPTX format file
- - 16:9 widescreen format suitable for all types of screens
- - Includes information about fonts, colors, and credits of the free resources used.
Related Items