


Premium PowerPoint Template and Google Slides Theme
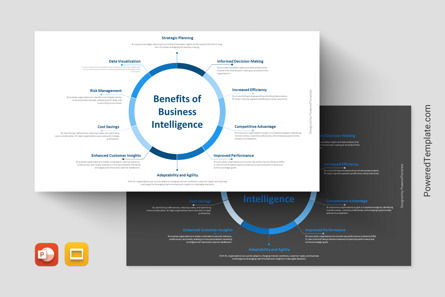
Elevate your presentations with our dynamic premium Business Intelligence Benefits Diagram, compatible with Canva, PowerPoint, and Google Slides. This visually striking circular visualization effectively showcases the myriad advantages of Business Intelligence (BI), empowering you to communicate the transformative impact of BI on organizational success.
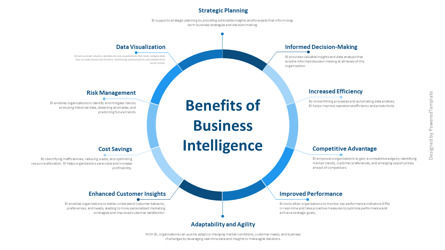
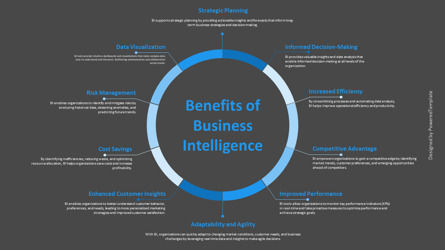
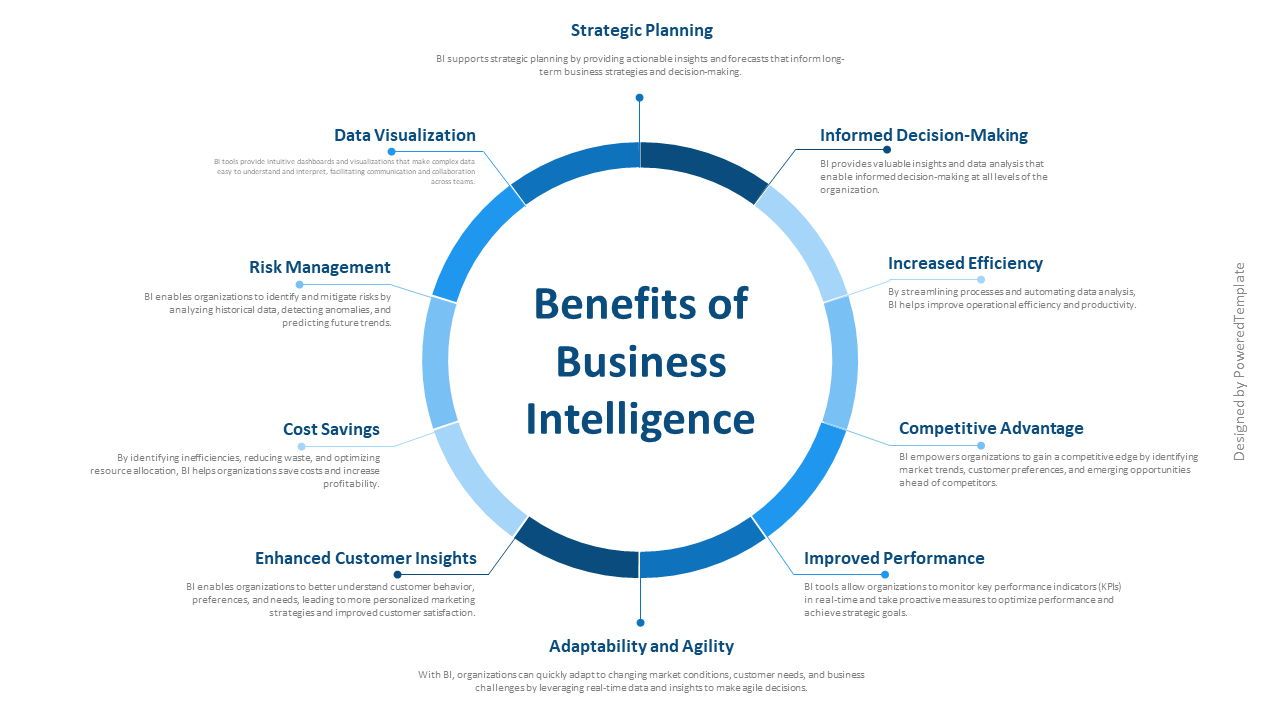
Business Intelligence (BI) refers to the systematic process of collecting, analyzing, and interpreting data to facilitate informed decision-making, strategic planning, and operational optimization within an organization. Short descriptions of the benefits:
- 1. Strategic Planning: Harness data-driven insights to formulate informed strategies and achieve organizational goals.
- 2. Data Visualization: Transform complex data into intuitive visual representations for enhanced understanding and analysis.
- 3. Informed Decision-Making: Empower stakeholders with actionable insights to make informed and timely decisions.
- 4. Risk Management: Identify and mitigate risks effectively through proactive data analysis and predictive modeling.
- 5. Cost Savings: Optimize resource allocation and operational efficiencies to achieve significant cost reductions.
- 6. Increased Efficiency: Streamline processes and workflows, driving productivity and efficiency across the organization.
- 7. Competitive Advantage: Gain a competitive edge by leveraging data to identify market trends, customer preferences, and opportunities.
- 8. Enhanced Customer Insights: Understand customer behavior, preferences, and needs to deliver personalized experiences and drive loyalty.
- 9. Improved Performance: Monitor key performance indicators (KPIs) and metrics to optimize performance and achieve business objectives.
- 10. Adaptability and Agility: Respond swiftly to changing market dynamics and emerging trends, ensuring organizational adaptability and agility.
This PPT template is ideal for business professionals, executives, analysts, and decision-makers seeking to communicate the benefits of Business Intelligence to stakeholders, investors, and organizational teams. It serves as a valuable resource for presentations, reports, and strategic discussions.
Download now and elevate your presentations with our visually captivating Business Intelligence Benefits Diagram. Empower your audience with insights into the transformative impact of BI on strategic planning, decision-making, and organizational performance.
Business Intelligence Benefits Diagram Presentation Template Features:
- - 100% editable and easy to modify
- - Contains easy-to-edit graphics
- - 2 dark and light slides to impress your audience
- - Designed to be used in Canva, Google Slides, and MS PowerPoint
- - PPT / PPTX format file ready for instant download
- - 16:9 widescreen format suitable for all types of screens
- - Includes information about fonts, colors, and credits of the free resources used.