
76397


Five Level Onion Chart - Free Google Slides theme and PowerPoint template

ID: 07254
Free for personal and commercial use with attribution required.
How to attribute the author?Unlock this file and gain access to other Premium resources.
Go Premium and Download! | Already Premium? Sign in
Free Google Slides theme and PowerPoint template
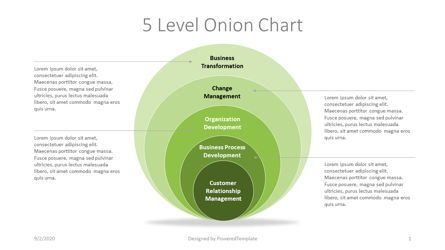
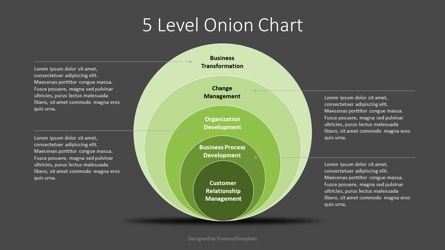
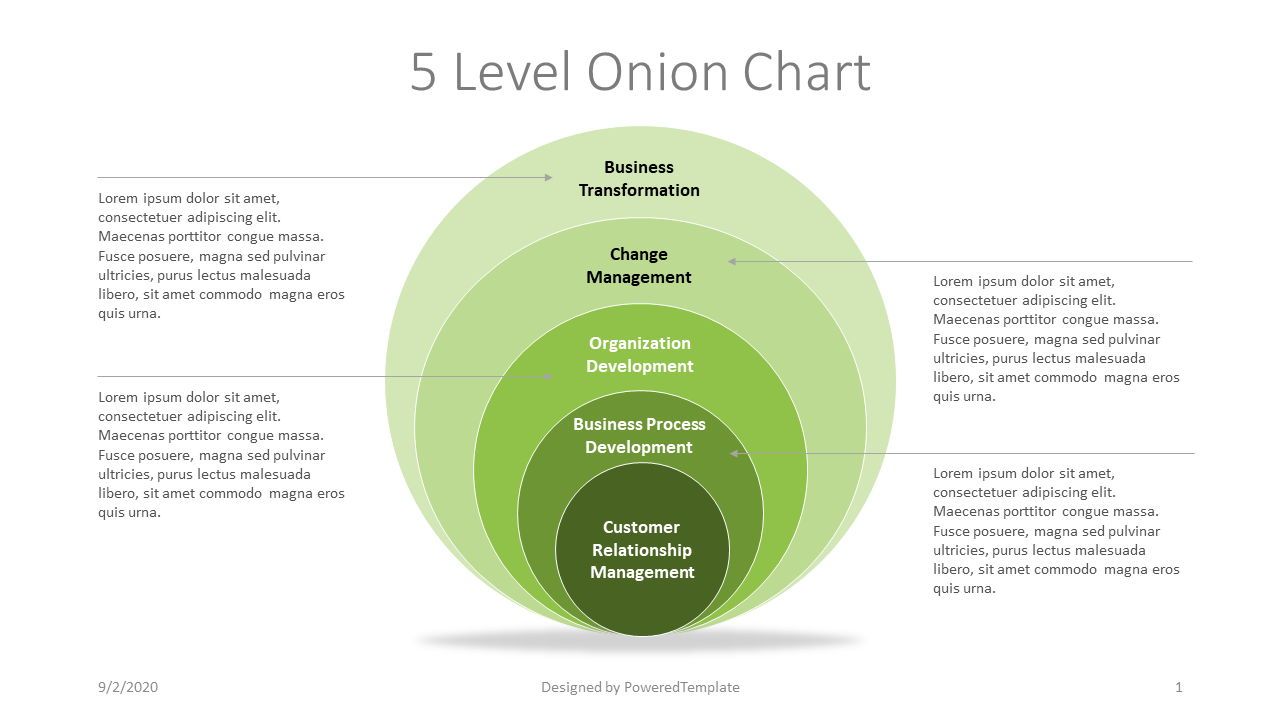
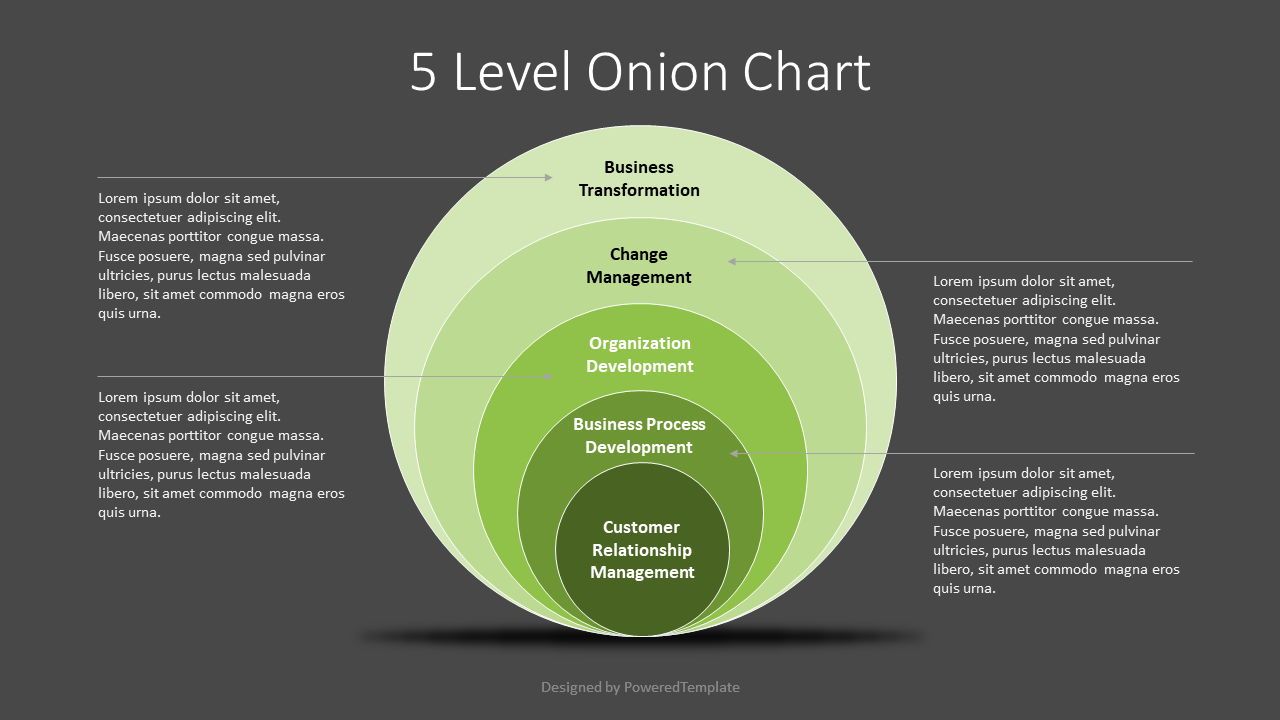
The onion diagram for presentations works in PowerPoint and Google Slides and shows layers created by concentric circles of a complete system in 5 circles.This onion diagram contains the next 5 levels of business management:
- Customer Relationship Management,
- Business Process Development,
- Organization Development,
- Change Management,
- Business Transformation.
An onion chart is a type of visual representation that can be used to summarize complex data in an easy-to-read format. It has five main keywords: layers, objects, concentration, connectivity, and relationship. The layers of an onion chart represent the different levels of detail within the data being examined.
The objects are symbols or visuals representing items in each level of detail and help to distinguish data points from one another. Concentration refers to the way in which each level of detail appears more frequently at certain points throughout the data set. Connectivity highlights connections between certain components of the data set, while relationships describe how individual points interact with one another. When viewed together, all five categories offer insight into patterns and trends within large amounts of data.
Template Features:
- * 100% editable and easy to modify
- * 2 dark and light slides to impress your audience
- * Contains easy-to-edit graphics
- * Designed to be used in Google Slides and Microsoft PowerPoint
- * PPT/PPTX format file
- * 16:9 widescreen format suitable for all types of screens
- * Includes information about fonts, colors, and credits of the free resources used.
Related Items