
100188


Flywheel Infographics for Presentations - Google Slides theme and PowerPoint template

ID: 10909
Unlock this file and gain access to other Premium resources.
Go Premium and Download! | Already Premium? Sign in
Unlock this file and gain access to other Premium resources.
Go Premium and Download! | Already Premium? Sign in
Premium Google Slides theme and PowerPoint template
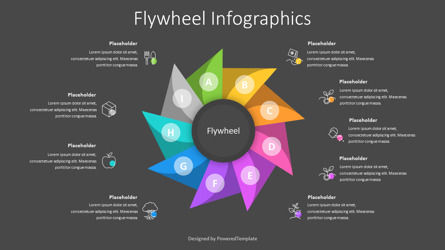
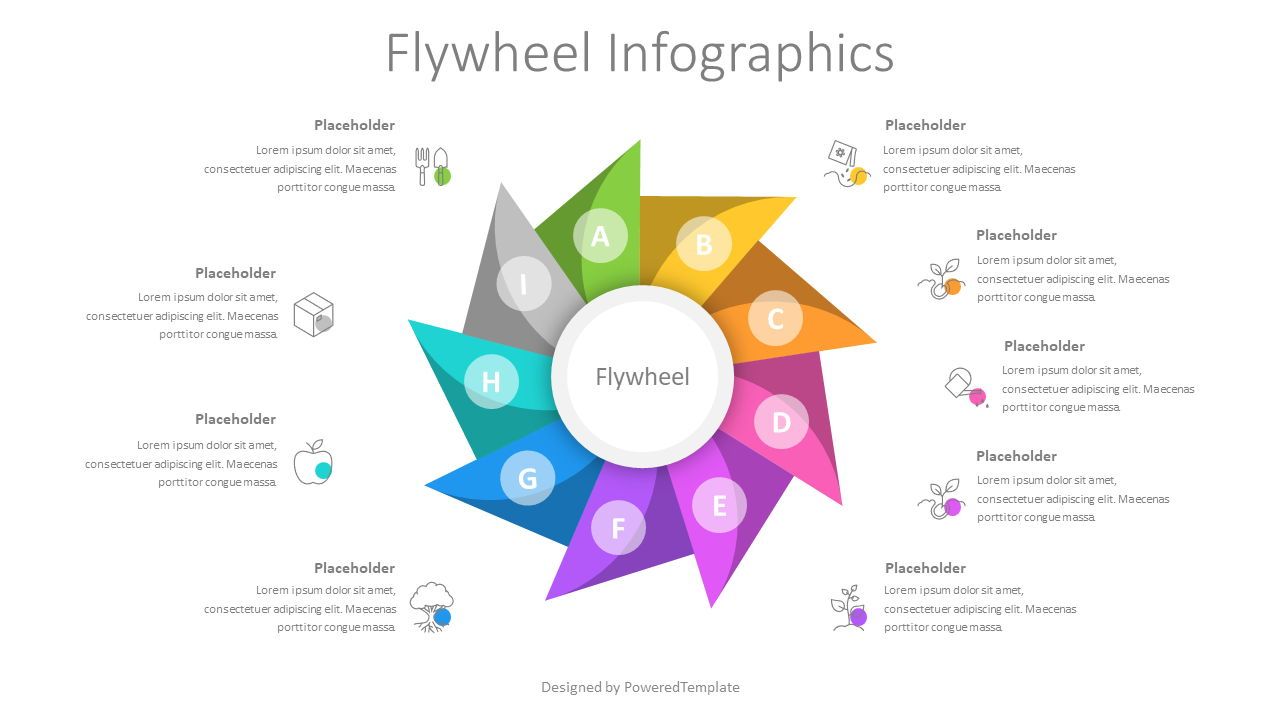
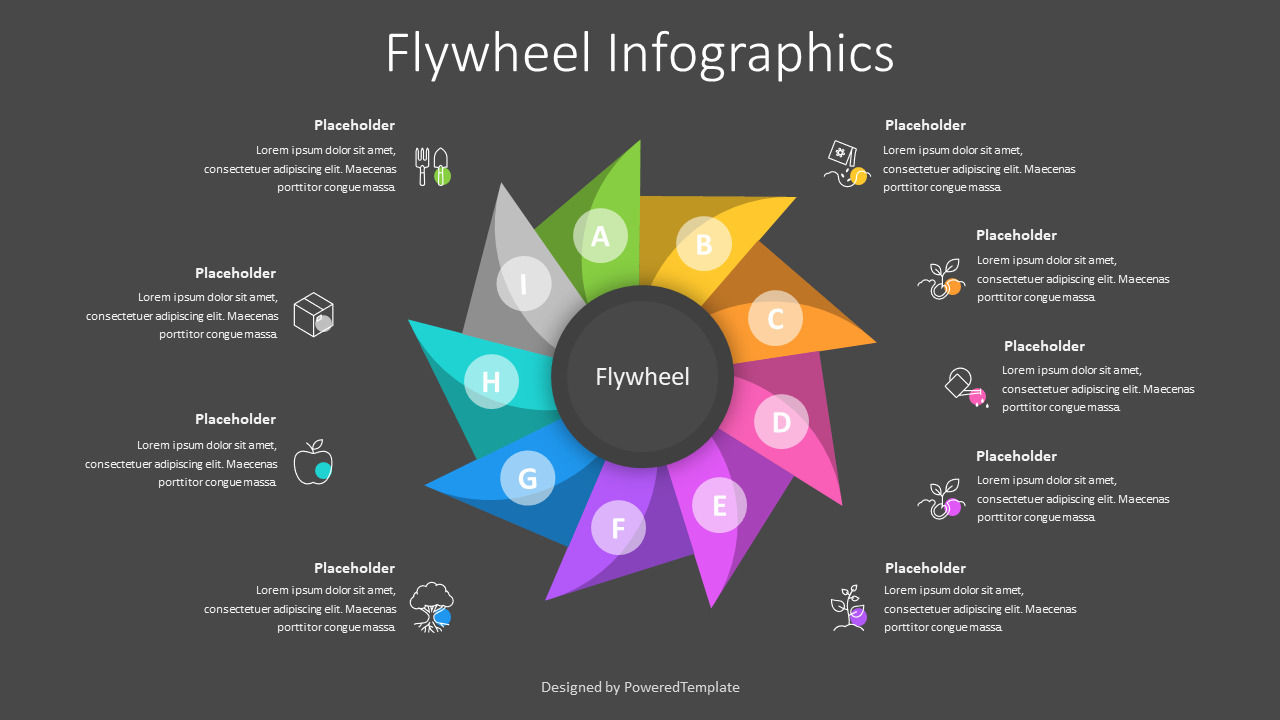
The Flywheel Infographics presentation template is a visually stunning and engaging tool that can be used for a wide range of business topics. This template features a circular geometric diagram with 9 colorful triangles, each representing a step or stage in a cyclic process. The design is modern and eye-catching, making it perfect for use in presentations where you want to capture your audience's attention and keep them engaged. With the option to customize the text placeholders and add your own icons, this template can be tailored to meet the specific needs of your presentation. The template is compatible with PowerPoint and Google Slides and comes with light and dark background options, making it easy to incorporate into your existing presentation materials.The Flywheel Infographics presentation template can be used in a wide range of fields and topics. It can be used to represent any cyclic process that involves different stages or steps. Some possible fields of use include business, marketing, project management, finance, and education.
In business and marketing, the Flywheel Infographics can be used to illustrate the different stages of a customer lifecycle, from acquisition to retention to advocacy. It can also be used to show the different components of a successful marketing strategy, such as branding, content marketing, and social media.
In project management, the Flywheel Infographics can be used to illustrate the different stages of a project lifecycle, from planning to execution to monitoring and control. It can also be used to show the different components of a successful project, such as team management, stakeholder engagement, and risk management.
In finance, the template can be used to illustrate the different stages of an investment lifecycle, from analysis to selection to monitoring and exit. It can also be used to show the different components of a successful investment strategy, such as asset allocation, risk management, and portfolio diversification.
In education, the Flywheel Infographics can be used to illustrate the different stages of a learning cycle, from planning to learning to assessment and feedback. It can also be used to show the different components of a successful learning strategy, such as curriculum design, teaching methods, and evaluation.
One example of a circular business process with 9 steps is the product development process, which typically involves a cyclical approach to continuous improvement. The 9 steps of this process can include:
1. Ideation: Generating new product ideas
2. Concept Development: Evaluating the feasibility and potential of the ideas
3. Market Analysis: Assessing the market demand and competition for the product
4. Business Analysis: Conducting a cost-benefit analysis to determine the financial viability of the product
5. Product Design: Creating a prototype and refining the product specifications
6. Testing: Conducting product testing and gathering feedback from customers
7. Launch: Introducing the product to the market
8. Marketing: Promoting and advertising the product to potential customers
9. Continuous Improvement: Gathering feedback and making changes to the product based on customer needs and market trends.
Template Features:
- - 100% editable and easy to modify
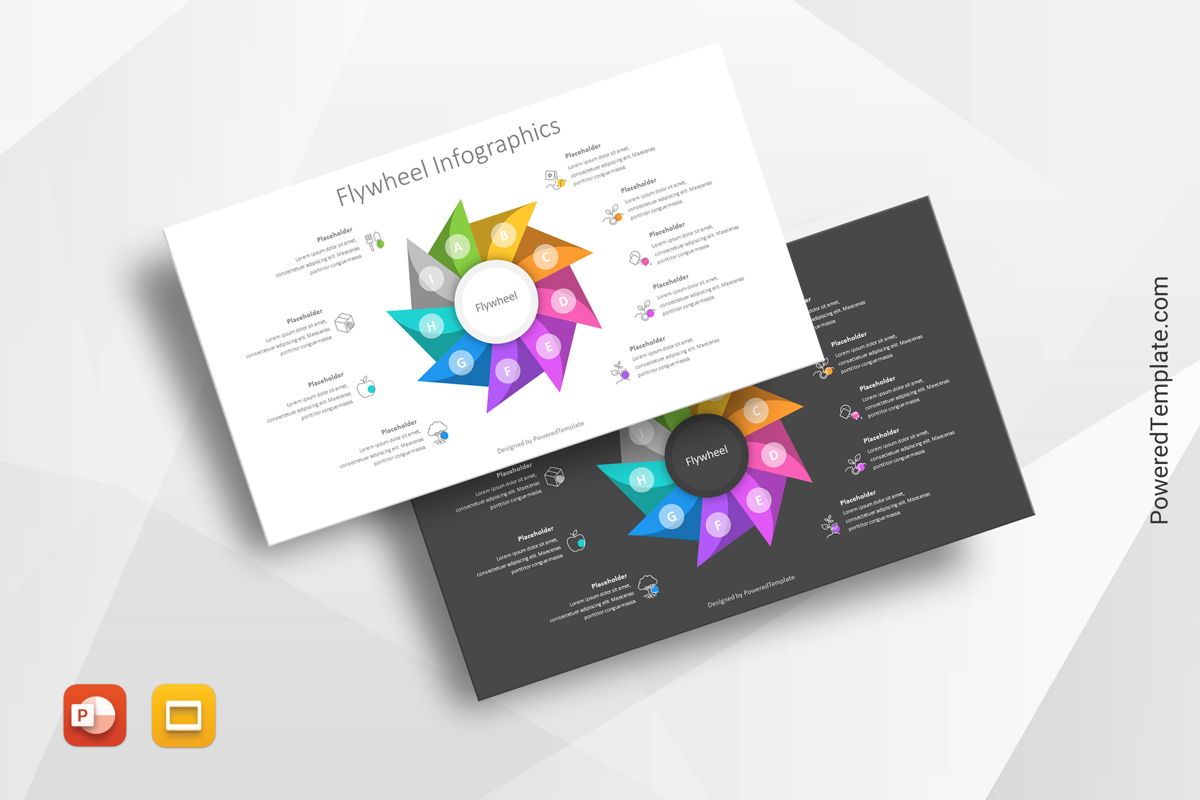
- - 2 dark and light slides to impress your audience
- - Contains easy-to-edit graphics
- - Designed to be used in Google Slides and Microsoft PowerPoint
- - PPT/PPTX format file
- - 16:9 widescreen format suitable for all types of screens
- - Includes information about fonts, colors, and credits of the free resources used.
Related Items