
33974


Radar Data-Driven Diagram (for PowerPoint and Google Slides)

ID: 00813
Unlock this file and gain access to other Premium resources.
Go Premium and Download! | Already Premium? Sign in
Unlock this file and gain access to other Premium resources.
Go Premium and Download! | Already Premium? Sign in
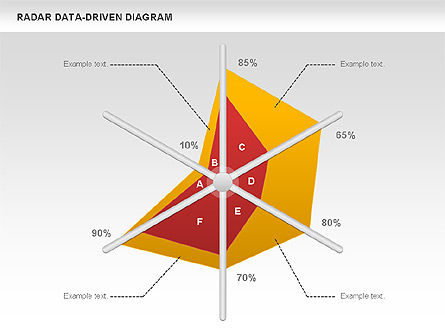
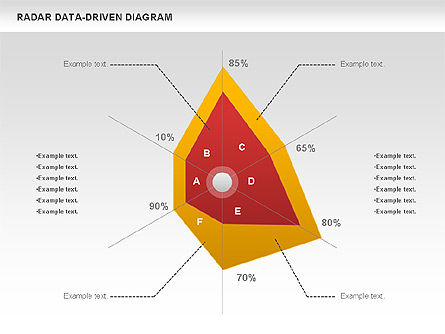
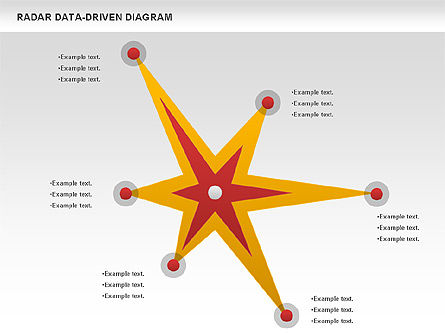
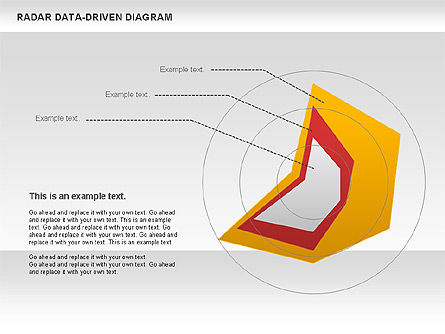
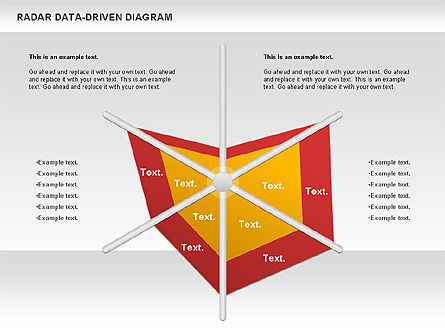
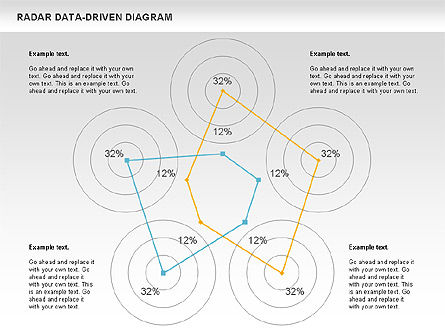
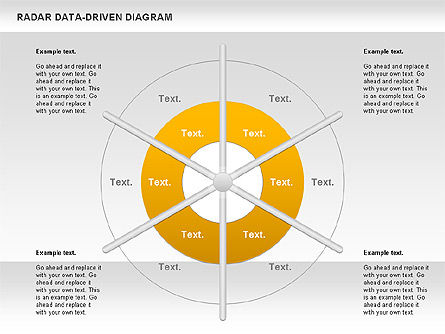
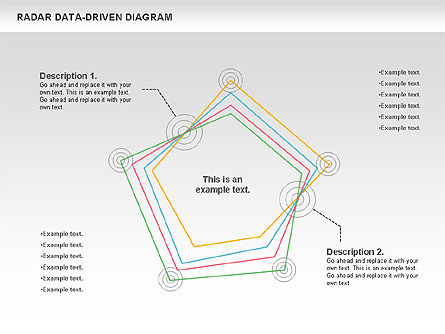
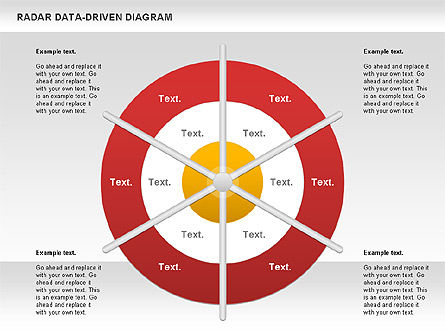
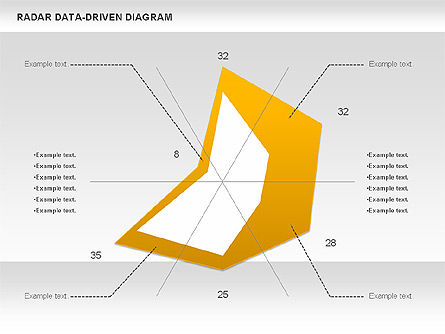
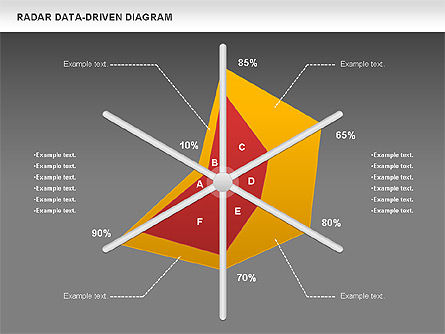
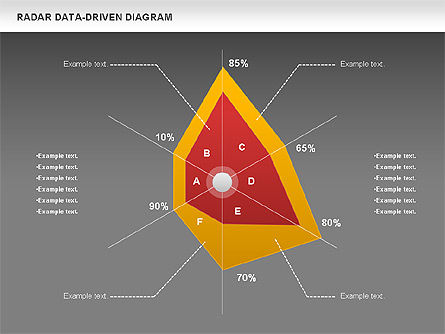
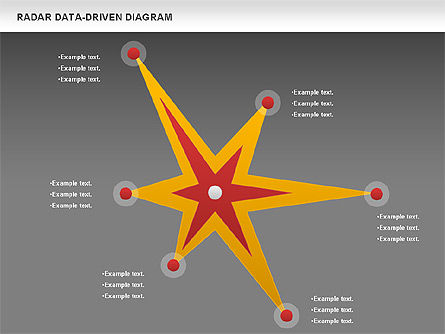
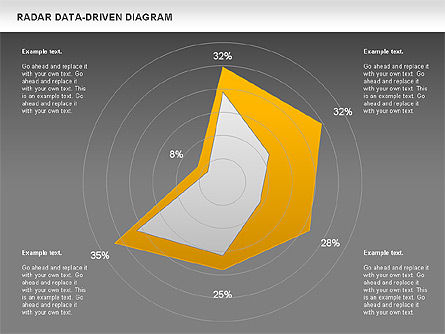
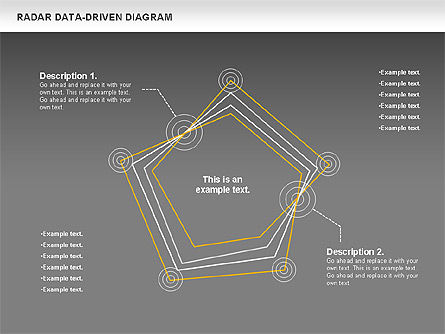
This set consist of data driven radar chart diagrams which also known as web chart, spider chart, star chart, star plot, cobweb chart, irregular polygon, polar chart or kiviat diagram. A data driven diagram performs computations in an order dictated by data dependencies. You can use it when it's necessary to show trends for several series and compare their values for the same points arguments on a circular grid that has multiple axes along which data can be plotted.
Download Free Samples. Charts and Diagrams Features.More...
Related Items