Top

Copy and paste the following code for attribution and get our Free License. Don’t want to provide attribution? Go Premium for more usage rights without attribution!

Infographics Presentation Charts, 02638, Infographics — PoweredTemplate.com
Infographics Presentation Charts, Slide 2, 02638, Infographics — PoweredTemplate.com
Infographics Presentation Charts, Slide 3, 02638, Infographics — PoweredTemplate.com
Infographics Presentation Charts, Slide 4, 02638, Infographics — PoweredTemplate.com
Infographics Presentation Charts, Slide 5, 02638, Infographics — PoweredTemplate.com
Infographics Presentation Charts, Slide 6, 02638, Infographics — PoweredTemplate.com
Infographics Presentation Charts, Slide 7, 02638, Infographics — PoweredTemplate.com
Infographics Presentation Charts, Slide 8, 02638, Infographics — PoweredTemplate.com
Infographics Presentation Charts, Slide 9, 02638, Infographics — PoweredTemplate.com
Infographics Presentation Charts, Slide 10, 02638, Infographics — PoweredTemplate.com
Infographics Presentation Charts, Slide 11, 02638, Infographics — PoweredTemplate.com
Infographics Presentation Charts, Slide 12, 02638, Infographics — PoweredTemplate.com
Infographics Presentation Charts, Slide 13, 02638, Infographics — PoweredTemplate.com
Infographics Presentation Charts, Slide 14, 02638, Infographics — PoweredTemplate.com
Infographics Presentation Charts, Slide 15, 02638, Infographics — PoweredTemplate.com
Infographics Presentation Charts, Slide 16, 02638, Infographics — PoweredTemplate.com

Quick Navigation Guide

Tap or click on the thumbnails here to view more images. You can also scroll left or right above or use the arrow keys on your keyboard.

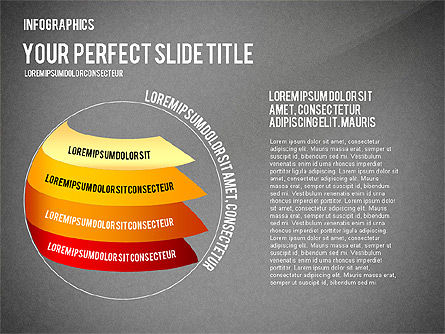
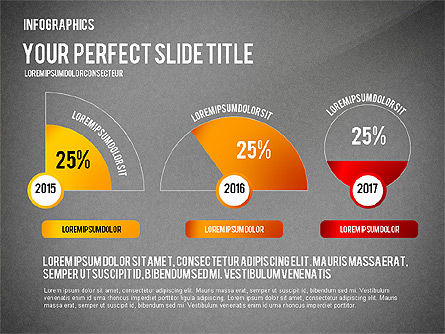
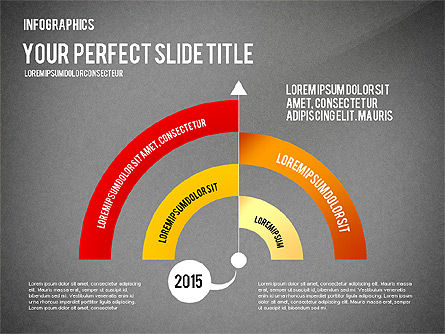
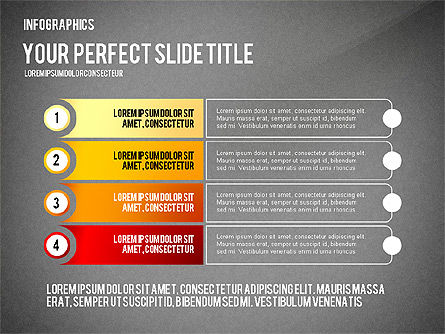
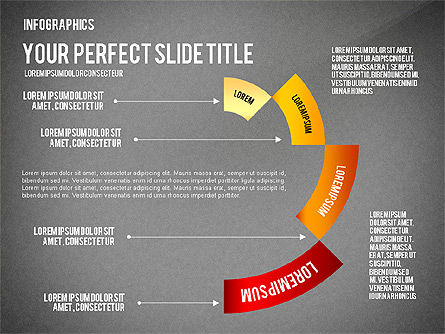
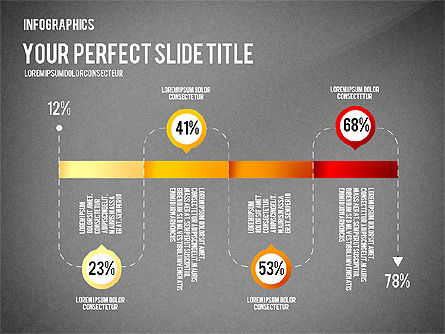
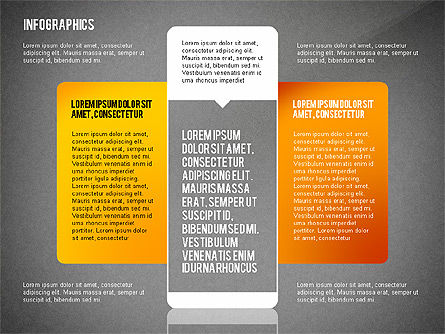
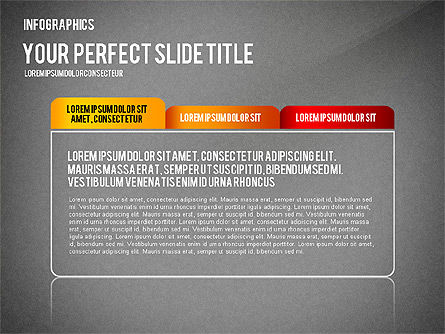
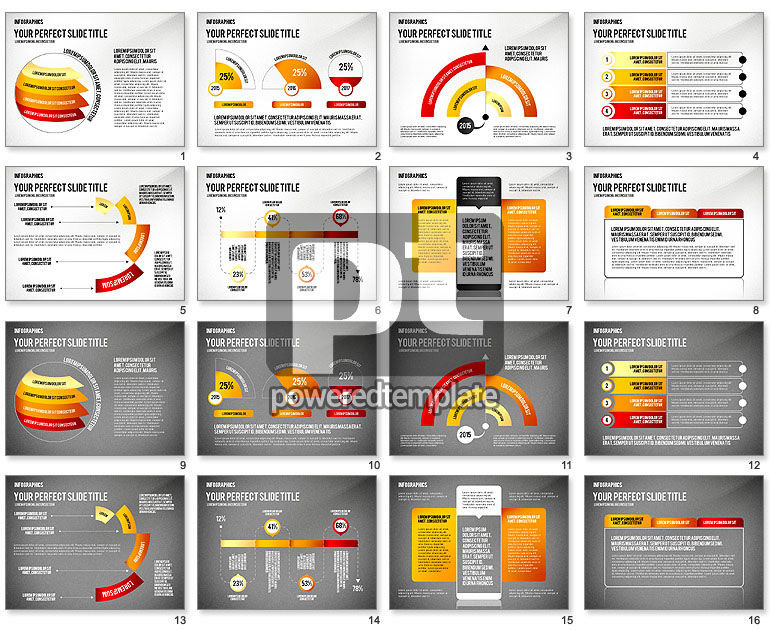
Infographics Presentation Charts (for PowerPoint and Google Slides)

Since July 18, 2004
ID: 02638
5.0 of 5(12)
Premium resource

Unlock this file and gain access to other Premium resources.

Go Premium and Download!  |  Already Premium? Sign in

Premium resource

Unlock this file and gain access to other Premium resources.

Go Premium and Download!  |  Already Premium? Sign in

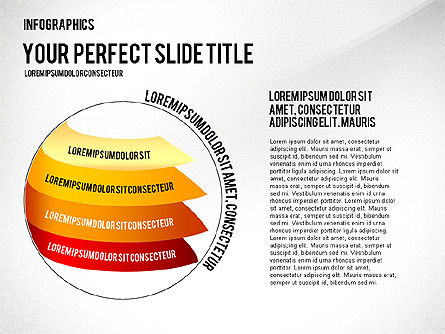
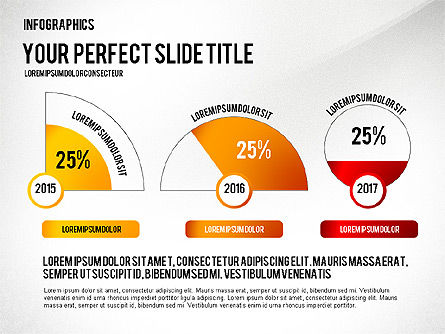
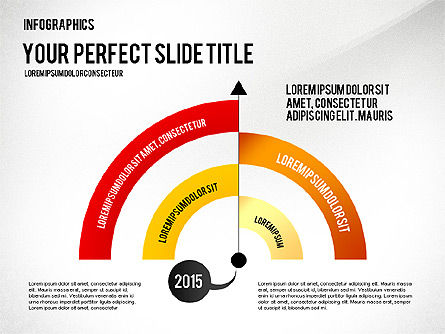
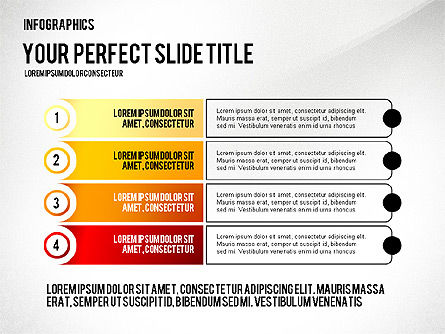
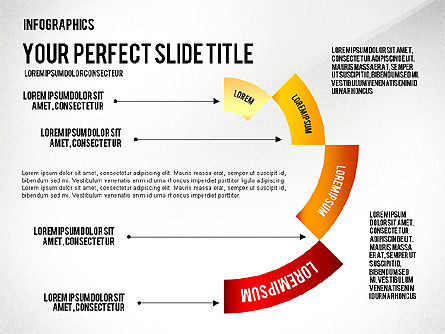
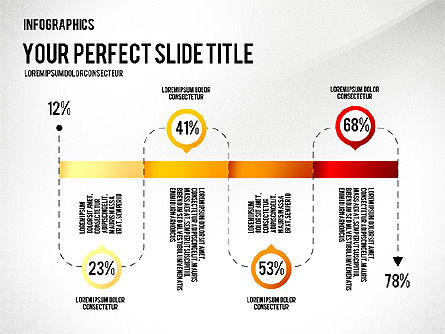
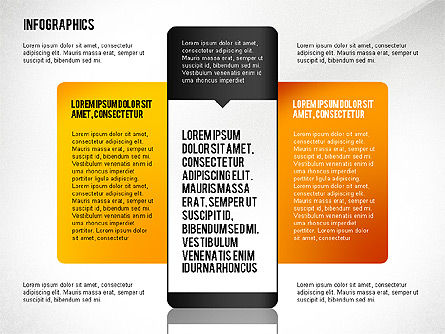
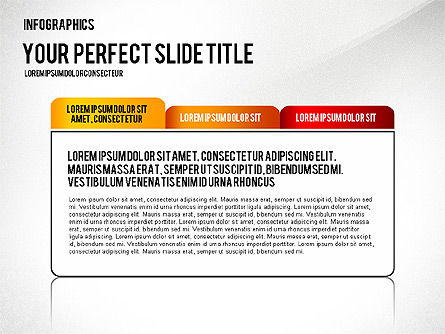
It is a very stylish bright theme that contains various items of different size and shape for your information, created in yellow-orange-red palette on two variants of the background, light and dark grey, with percentage and numbers. This great template may suit ideally to presentations dedicated to management, success, research, strategic planning, consulting, choosing the way, development, etc. Download Free Samples. Charts and Diagrams Features.More...
Infographics Presentation Charts

Related Items

You have not viewed any products yet.

Start browsing our template library and here will be stored your history of viewed products.

Use "Favorites" to save products you find interesting, to compare them and add to cart. To add products in favorites you must first register or login. Registration is Free!

To add a product to "Favorites" simple click on near product's image.