
99493


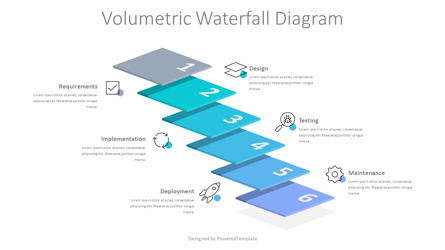
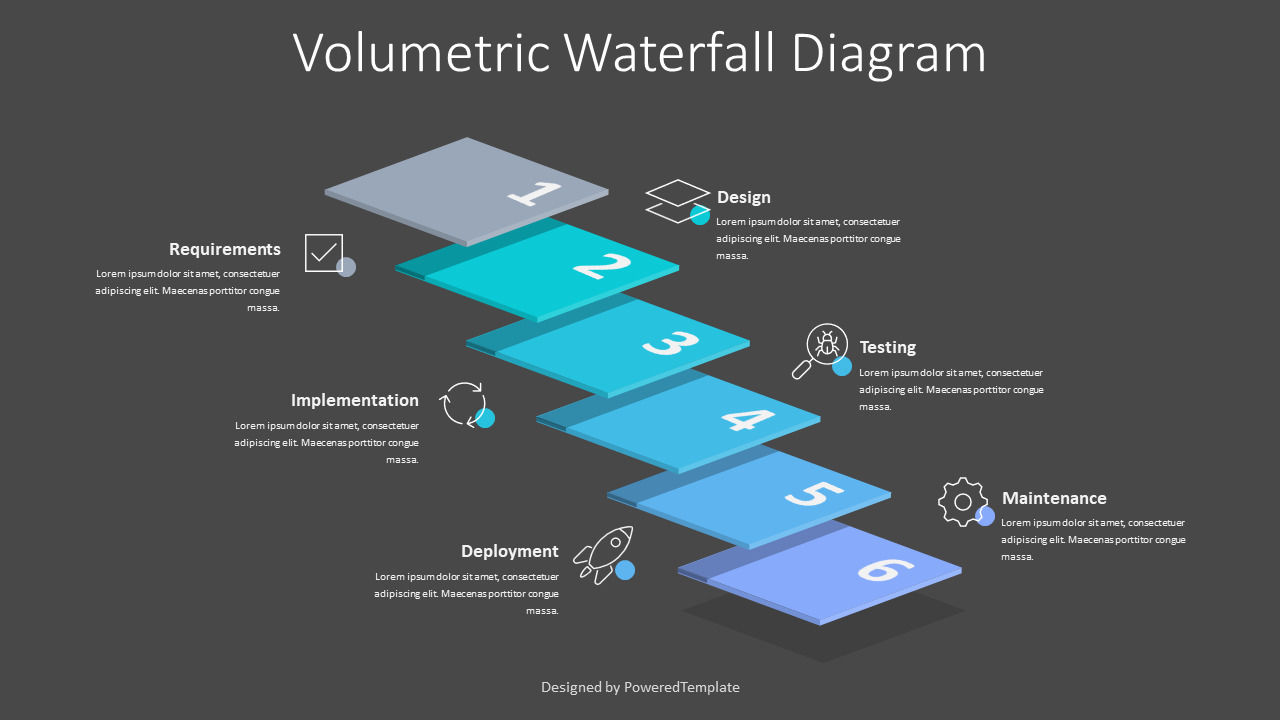
Volumetric Waterfall Diagram - Google Slides theme and PowerPoint template

ID: 10803
Unlock this file and gain access to other Premium resources.
Go Premium and Download! | Already Premium? Sign in
Unlock this file and gain access to other Premium resources.
Go Premium and Download! | Already Premium? Sign in
Premium Google Slides theme and PowerPoint template
The Volumetric Waterfall Diagram is a presentation template that works in PowerPoint and Google slides and is a visual representation of the process or workflow for a project. It utilizes a sequence of 6 visually connected volumetric rectangles in an isometric perspective, each representing a step or phase in the development, to display how activities are planned and completed. The vertical lines connecting the rectangles signify that one activity must finish before the next activity takes place. This diagram visually illustrates how complex projects, such as software development and product manufacturing, should flow from beginning to end. It also defines which steps in the process are dependent upon one another for completion – all critical elements when it comes to ensuring success within any project.Waterfall diagrams, also known as waterfall charts, are a graphic representation of the cumulative effect of sequentially introduced positive or negative values. They are widely used by engineers and scientists to analyze data and depict changes over time. It is helpful to visually identify participants' progress in stages of a project and identify possible areas for improvement. For example, it could be used to illustrate revenue growth over the course of an economic quarter by charting total income from various sources. Waterfall diagrams can also be useful for identifying errors or trends in various experiments or projects with 6 steps, stages, phases, or parts, making them versatile tools for structured problem-solving.
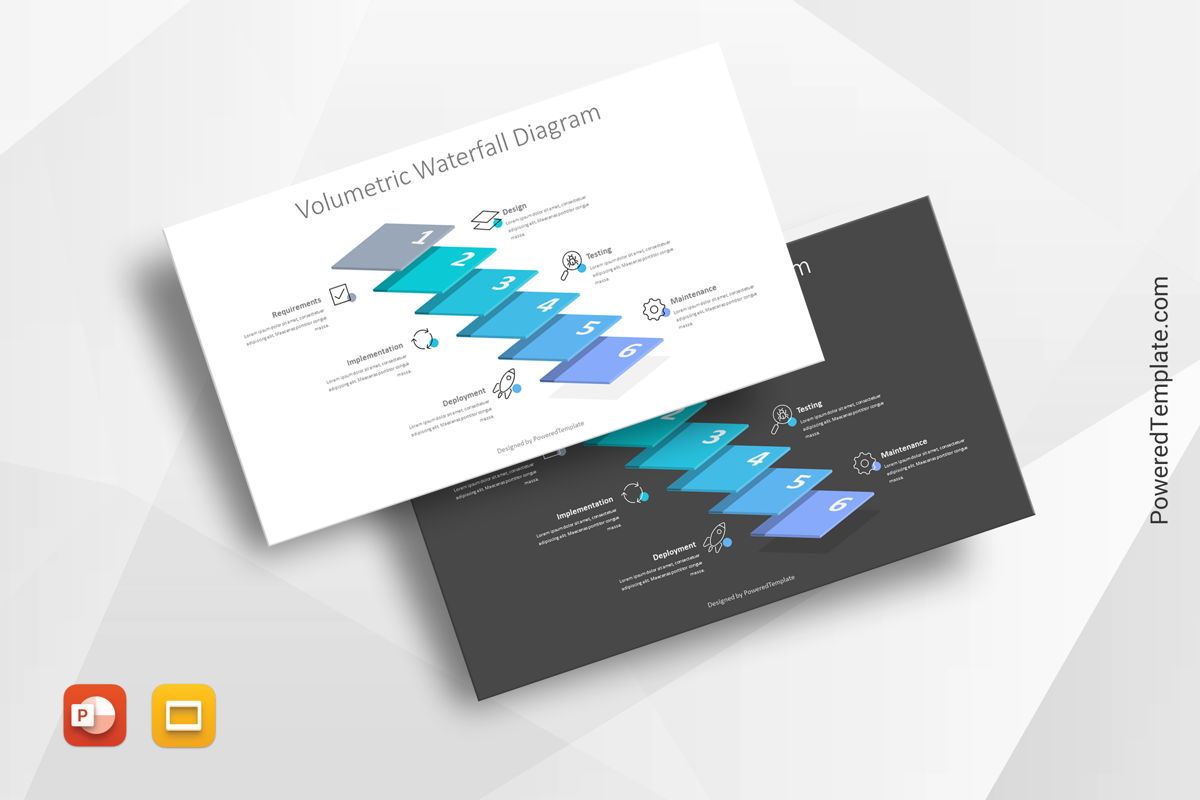
Template Features:
- - 100% editable and easy to modify
- - 2 dark and light slides to impress your audience
- - Contains easy-to-edit graphics
- - Designed to be used in Google Slides and Microsoft PowerPoint
- - PPT/PPTX format file
- - 16:9 widescreen format suitable for all types of screens
- - Includes information about fonts, colors, and credits of the free resources used.
Download Free Samples. Charts and Diagrams Features.More...
Related Items