
35836
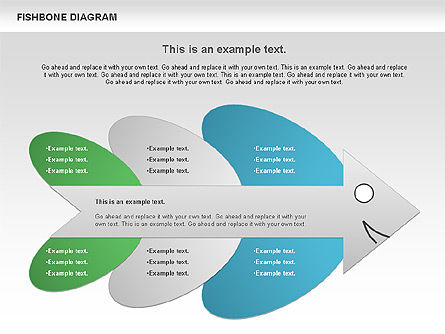
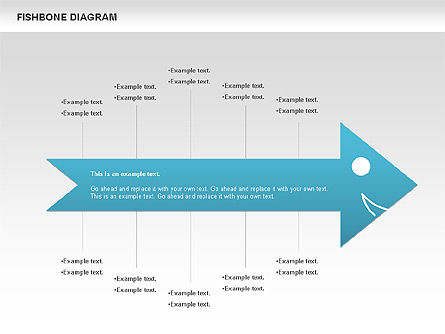
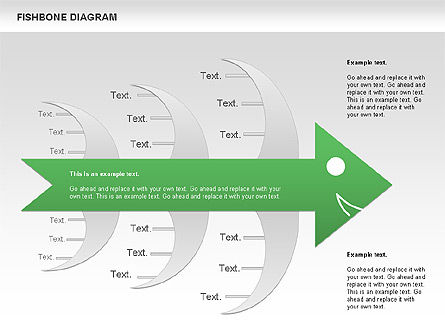
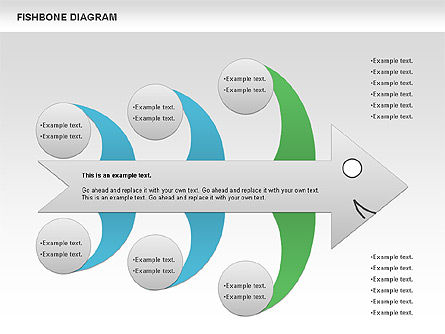
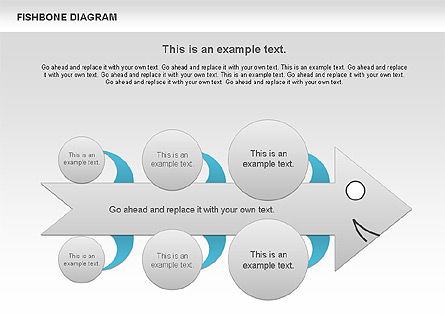
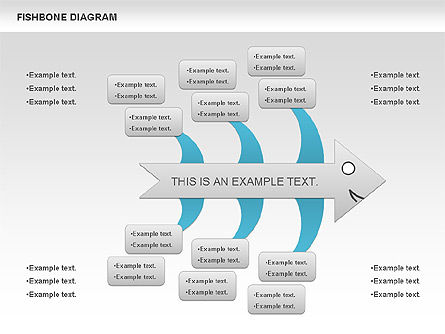
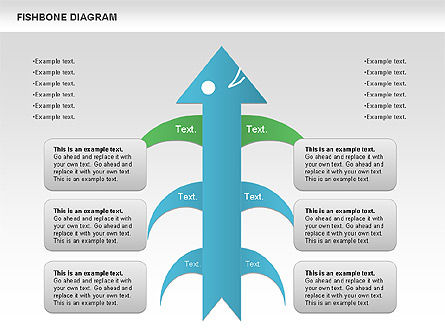
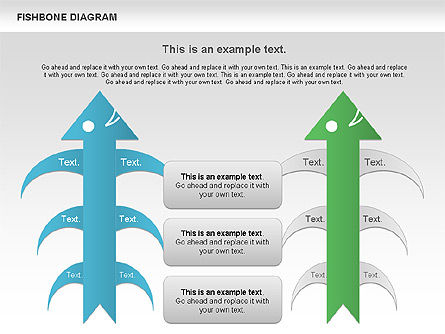
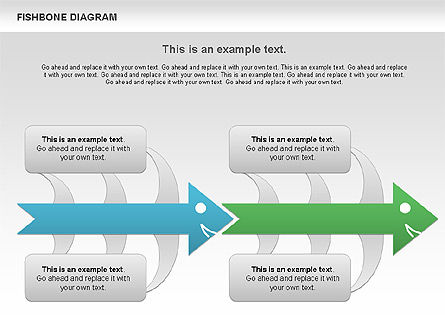
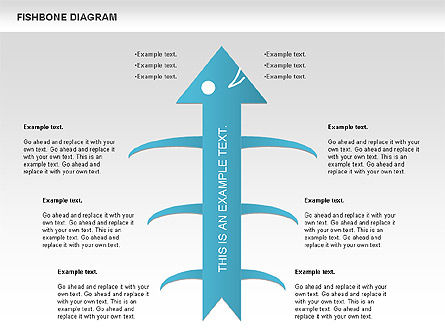
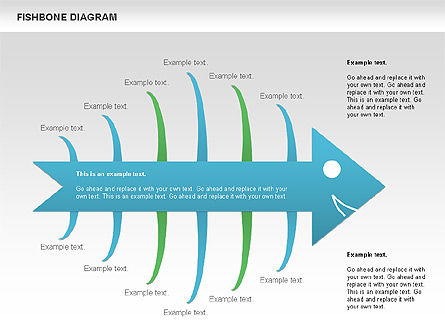
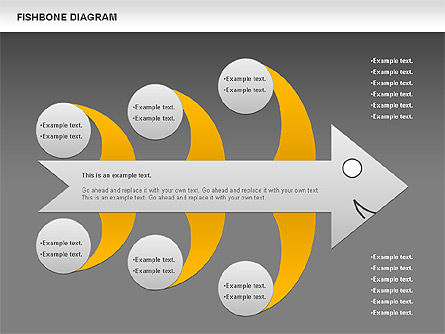
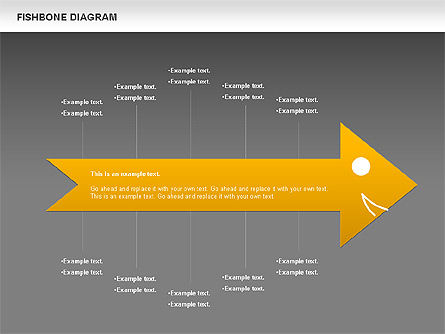
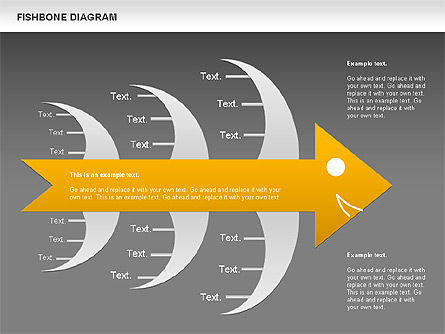
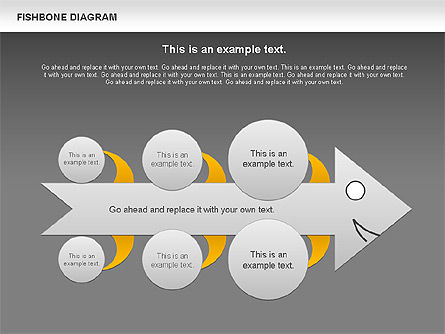
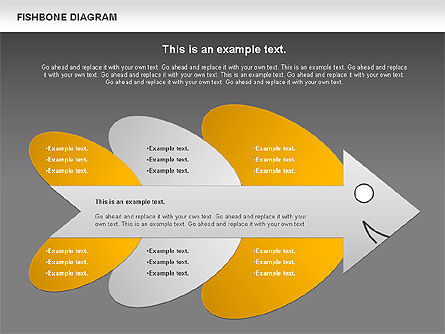


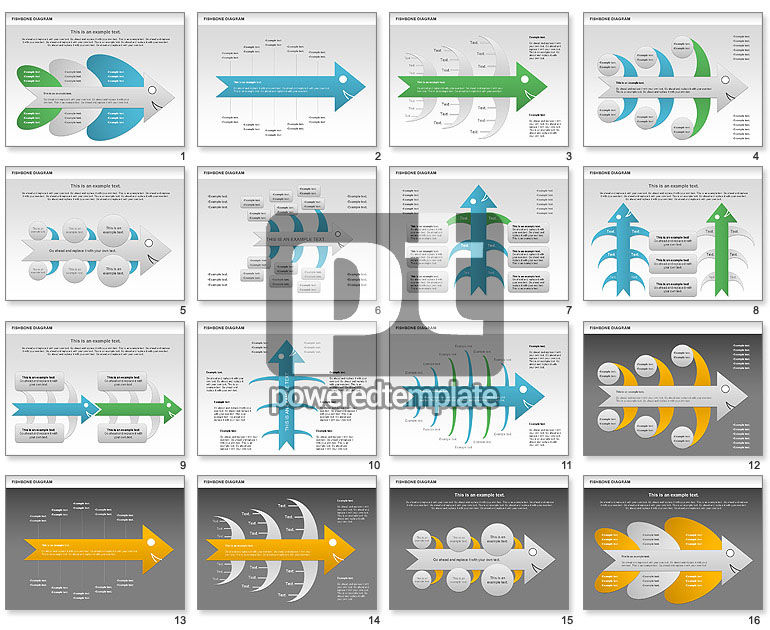
Colorful Fishbone Diagram (for PowerPoint and Google Slides)

ID: 00944
Unlock this file and gain access to other Premium resources.
Go Premium and Download! | Already Premium? Sign in
Unlock this file and gain access to other Premium resources.
Go Premium and Download! | Already Premium? Sign in
Colorful Fishbone Diagram another words Ishikawa Diagram or characteristic diagram will be ideal choice for analyzing and presenting causal factors and drive improvement plans and actions. Better to use in presentations on business and economical analysis, financial analysis, etc.
Download Free Samples. Charts and Diagrams Features.More...
Related Items